Infection Rates (2020 - 2022)
Daily cases
Symptomatic vs. Asymptomatic Cases
Prior to July 2021, KKM tested asymptomatic close contacts. This resulted in up to 90% of all cases being asymptomatic. In July 2021, Hisham announced that they would not test asymptomatic close contacts anymore. After mid-October 2021, the % of asymptomatic cases were as low as 20%. This results in an imbalance if you were to compare daily cases before and after July 2021. That is to say, numbers before July 2021 were overblown, and once cases went crazy high after vaccination started, they stopped testing the asymptomatic to make daily case numbers lower.
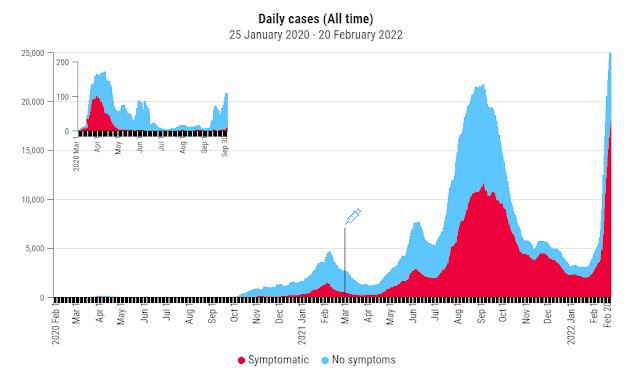


2020: Case numbers in early 2020 were very low. Lockdowns were too harsh a response to such low numbers and caused more harm than good. Maximum only 100 cases per day in the whole country!
Daily cases
Daily cases

Cases after vaccination started on Feb 24, 2021.
Infection Rates

The percentage of unvaccinated cases is now lower than the percentage of unvaccinated people in the population. Since vaccines are given to illegal foreigners, the population used to calculate the percent of vaccine recipients should also include illegal foreigners, but the official population numbers given by the Ministry of Health only counts Malaysian citizens and legal foreign residents. The official population is 32.7 million, but the population including illegal foreigners is 34.7 million by my calculations. All these graphs use the population of 34.7 million.
Calculation of Malaysian population including illegal foreigners:
https://mycovidgraphs.blogspot.com/2021/11/the-malaysian-population-including.html
Calculation of Malaysian population including illegal foreigners:
https://mycovidgraphs.blogspot.com/2021/11/the-malaysian-population-including.html
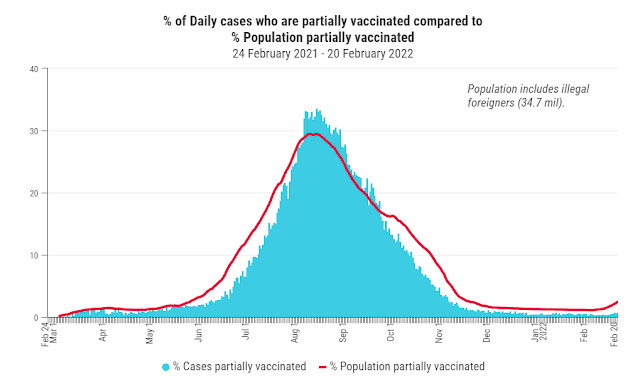
The blue section where it is lower than the red line means the vaccine was effective at reducing infection rates for this population. The section where it is higher than the red line means they were infected at higher rates than their portion of the population.

The red section that is lower than the line means the vaccine was effective at reducing infection rates. This worked for a few months. Infection rates then caught up and exceeded their portion of the population.

Similarly, the booster shot reduced infection rates for only a while before infection rates quickly caught up.

This charts shows what percent of each group is infected. Full vaccination and booster vaccines reduced the infection rate for a while, but the infection rate for these two groups has exceeded the unvaccinated. Vaccination with one dose shows an advantage as the infection rate is less than the vaccinated for much (but not all) the time.
* Note that people who took their first dose and got infected or died on the same day are counted under the unvaccinated group.

If we straightened out the green (unvaccinated) line from the previous chart, this shows the other lines relative to the unvaccinated. Lines above zero means the vaccine was effective at reducing infection rates compared to the unvaccinated. The partially vaccinated (light blue line) averaged 30% effectiveness. Full vaccination reduced infections for 6 months, after which it dipped into negative effectiveness, which means they are now infected at higher rates than the unvaccinated. The booster was only good for 3 months before it too descended into negative effectiveness. This is not waning of immunity. If immunity waned, their infection rate would return to zero, at the same level as the unvaccinated. This is the destruction of the immune system.

Who spreads more viruses?

This could also mean that there is more deliberate testing of asymptomatic unvaccinated people.

Cases by age group

Cases of children and adolescents go up and down with adult cases.


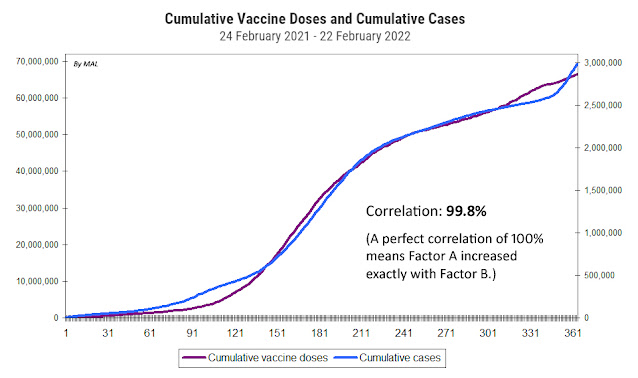
The infection rate of adults (light purple line) follows vaccine doses (red line) in lockstep. The infection rate for seniors (dark purple line) also increased in lockstep with vaccination, but at a lower rate. Since the whole country was locked down and most people could not go to work or eat out, this suggests that people got infected at the PPVs, as the lines follow the vaccine doses exactly.

The infection rate for children and adolescents (green lines) followed that of adults (purple line) in lockstep. Children did not go to school at this time, nor were they allowed in most supermarkets. This means that adults got infected at the PPV, then came home and infected their children.

Did mega PPVs drive the pandemic?
Big Wave #1
Cases increased in lockstep with vaccine doses given. The country was locked down after Hari Raya, but cases started going up vertically even during lockdown when smaller PPVs were closed and combined into mega PPVs. Delta was just beginning and being highly infectious, was spread at huge gatherings at PPVs and Covid Assessment Centres (CACs), where people sat in a very crowded place for many hours.
Cases started going down as quickly as it went up, with the closure of mega PPVs. In mid-September, vaccination for teenagers started. It was given in their schools, and it did not cause an increase in cases. This shows that huge gatherings at mega PPVs caused the vertical increase in cases, while smaller centres did not cause such problems.
Big Wave #2

Comments
Post a Comment